
US Medical Debt Report
How does medical debt vary across the country?
Receiving medical treatment can be an unpleasant experience at the best of times, but the added pressure of sky-high medical bills means many patients are discharged with huge sums of debt. These high costs are present across the US health industry, making access to medicine, consultations, and treatment a costly financial burden that many households simply cannot afford.
Thankfully, there are ways of making healthcare more affordable on a day-to-day basis. Ensuring you have adequate insurance coverage is incredibly important for making sure you have access to medical treatment in an emergency, though many plans do not cover medication and other costs that can add up over time.
Luckily, you can now get affordable medications online by signing up for a service such as NiceRx, where you will receive your monthly prescriptions for a fraction of the regular retail price. This service is available for accessing a wide range of medications directly from pharmaceutical companies, including popular brand names such as Mounjaro (tirzepatide), which is commonly used to aid in weight loss.
Despite there being several ways to reduce the burden of medical expenses, huge numbers of Americans still find themselves with substantial medical debt. With this in mind, we at NiceRx wanted to find out who in the US has the most medical debt. We’ll reveal which demographics in the country bear the largest financial burden for medical expenses, as well as looking at the difference in debt levels from state to state.
Medical debt by age and generation
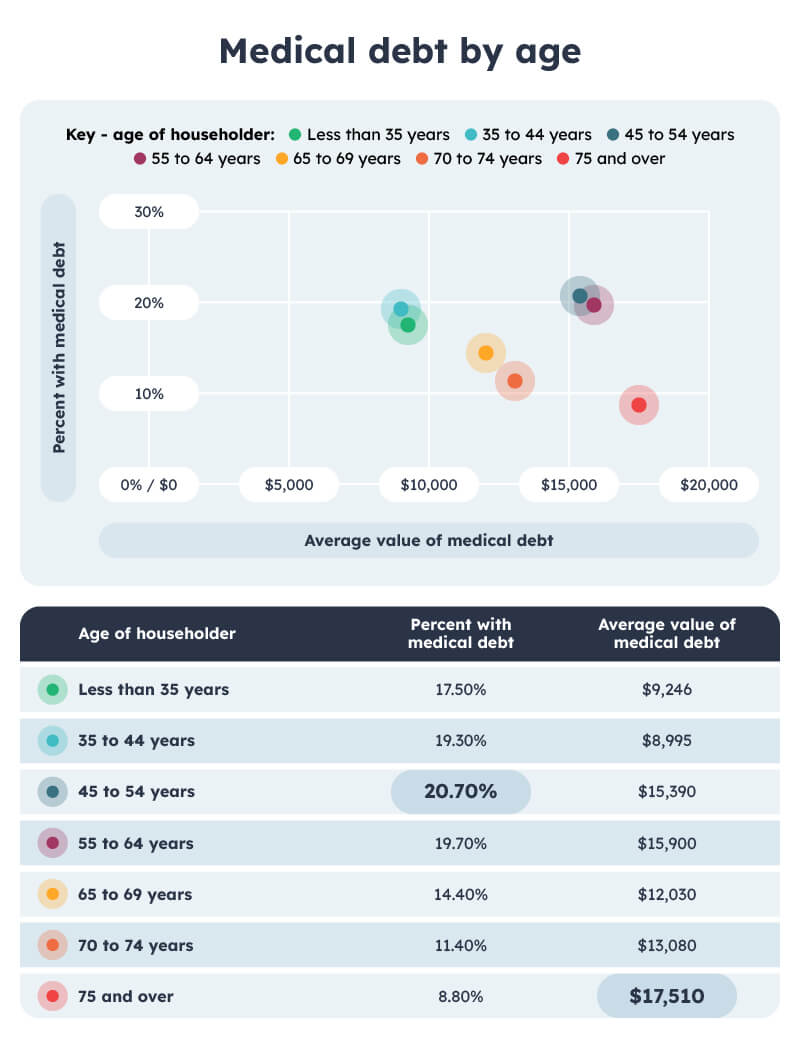
Age group where medical debt is most prevalent:
Age group: 45 to 54 years
Percent with medical debt: 20.70%
The age group where the most people have some level of medical debt are those between 45 and 54 years of age, with 20.70% of people having medical debt. This means more than 1 in 5 Americans in this age range are dealing with medical debt.
The age group with the highest average medical debt:
Age group: 75 and over
Average value of medical debt: $17,510
The age group with the highest level of medical debt is also the oldest, with people aged 75 and over having an average medical debt of $17,510. While this could make sense as older people generally have more health conditions, and they’ll have had longer to accumulate the debt, they also have to balance the cost of this debt with their retirement funds, which can be tricky to do.
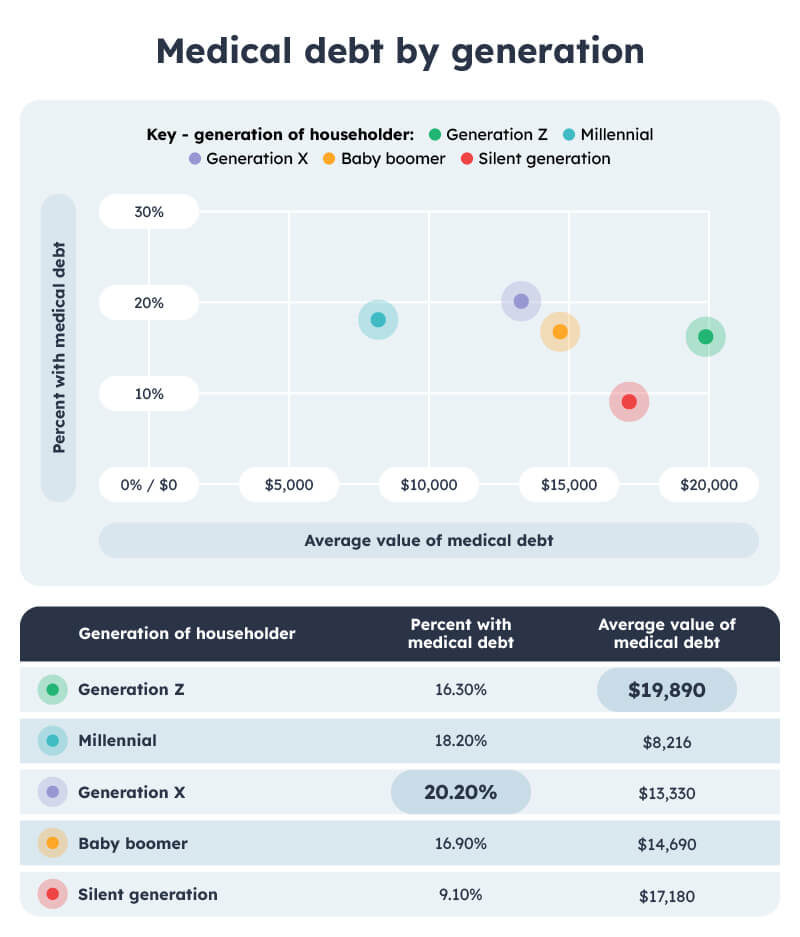
The generation where medical debt is most prevalent:
Generation: Generation X
Percent with medical debt: 16.30%
The generation where medical debt is most common is Generation X, with 16.30% of people owing money for medical expenses. This means that people born between 1965 and 1980 are the most likely to hold medical debt.
The generation with the highest average medical debt:
Generation: Generation Z
Average value of medical debt: $19,890
The generation with the highest average medical debt is Generation Z, where the average amount owed is $19,890. This means that the youngest generation is also bearing the largest financial burden from medical debt. This could be a problem for many people as younger workers tend to earn less than their older and more senior colleagues.
Medical debt by household income
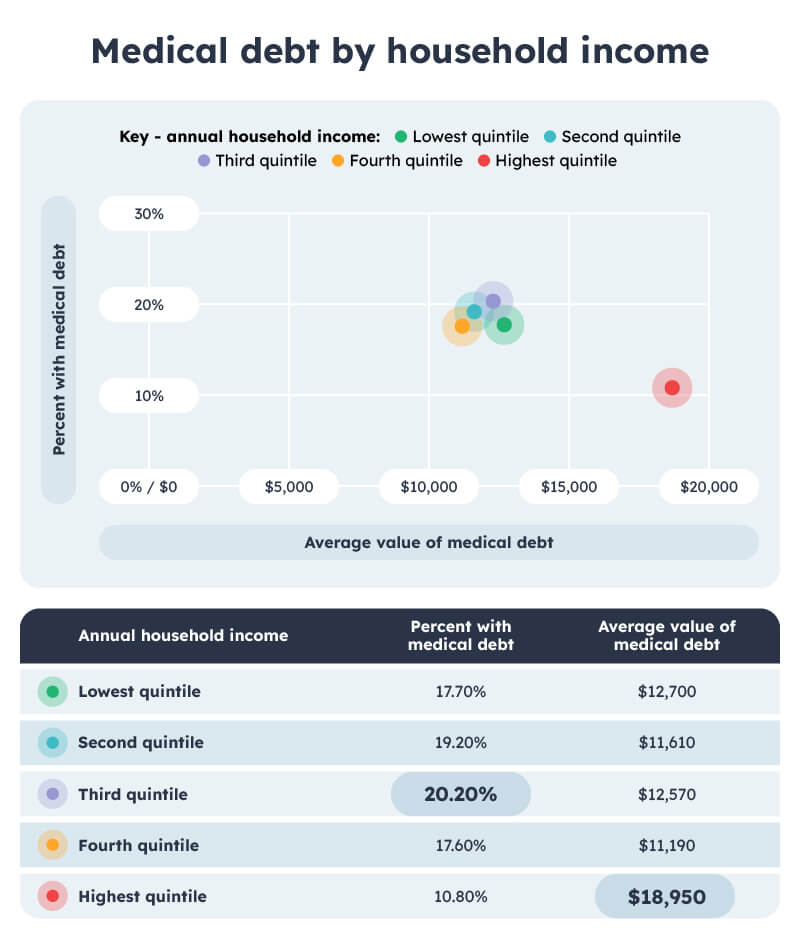
Here we can see the levels of medical debt held by different earning brackets. The data has been split into quintiles, each representing 20% of workers, with the lowest earners in the lowest quintile.
The income bracket where medical debt is most common is the third quintile. This means that those earning mid-range salaries are most likely to have medical debt, which is the case for 20.20% of people in this bracket.
The earners with the highest average value on medical debt are in the top quintile, with average debts of $18,950, meaning the highest earners also owe the most for medical expenses.
Medical debt by ethnicity
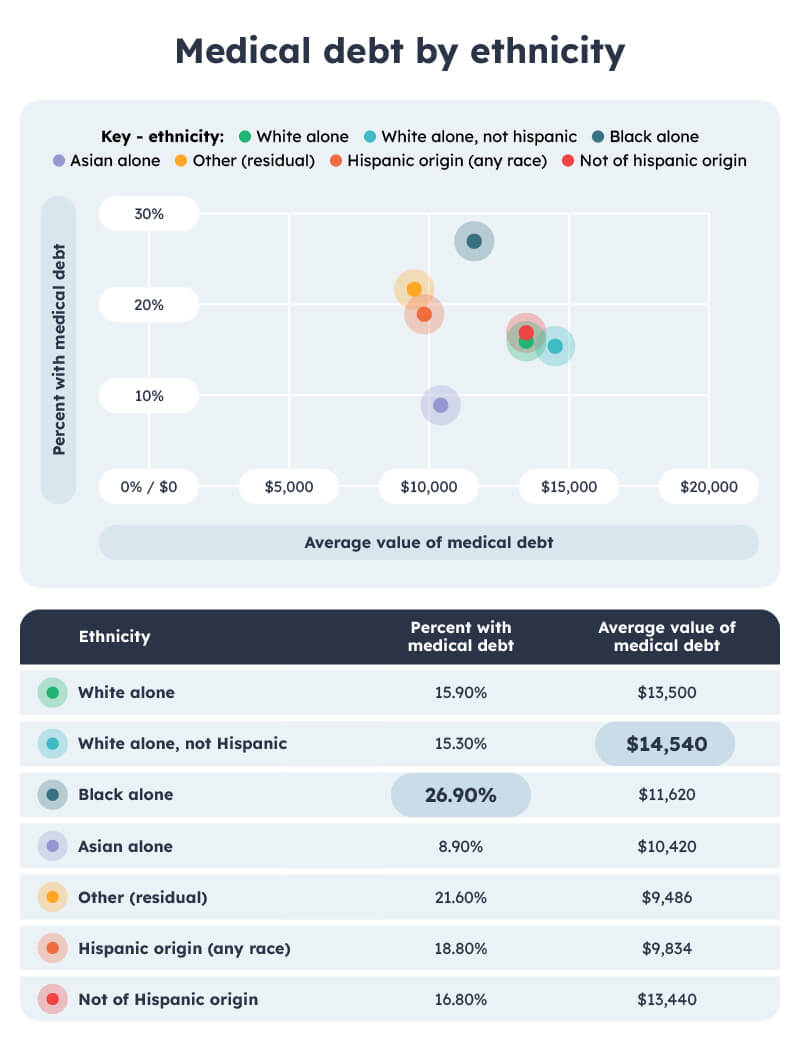
26.90% of black people in the US have medical debt, making them the ethnic group where medical debt is most common. Conversely, Asian people have the lowest prevalence of medical debt at just 8.90%.
However, the high prevalence of medical debt that black people experience does not translate into high average debt, as non-Hispanic white people have the highest average medical debt at $14,540.
Medical debt by disability status
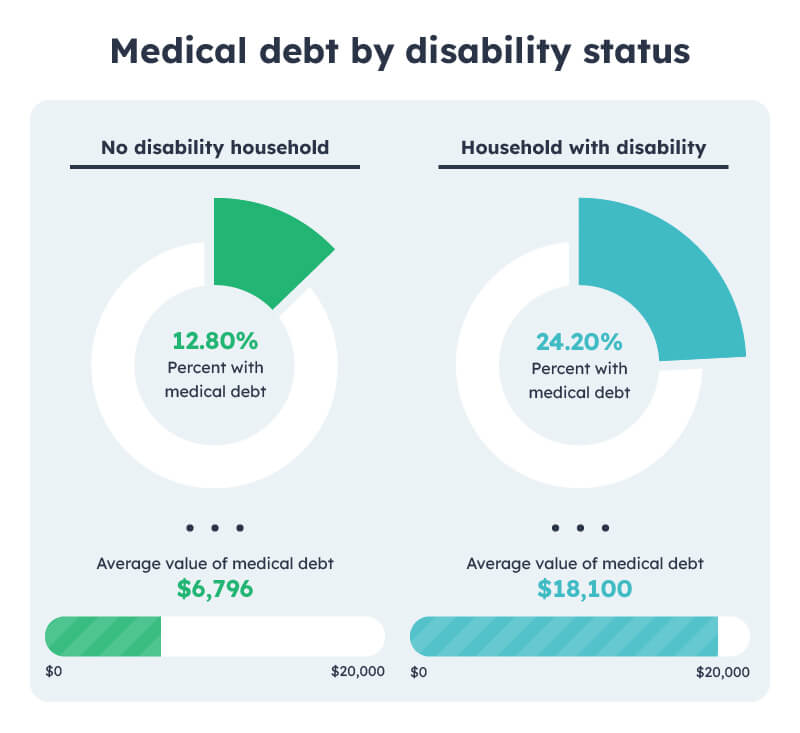
There is also a marked difference in levels of medical debt between those with disabilities and those without. Households with at least one disability are almost twice as likely to have medical debts than those without, with prevalence rates of 24.20% compared to 12.80%.
The average value of medical debt is also much higher for households with a disability, being almost three times higher than those without a disability at $18,100 compared to $6,796.
Medical debt by insurance coverage
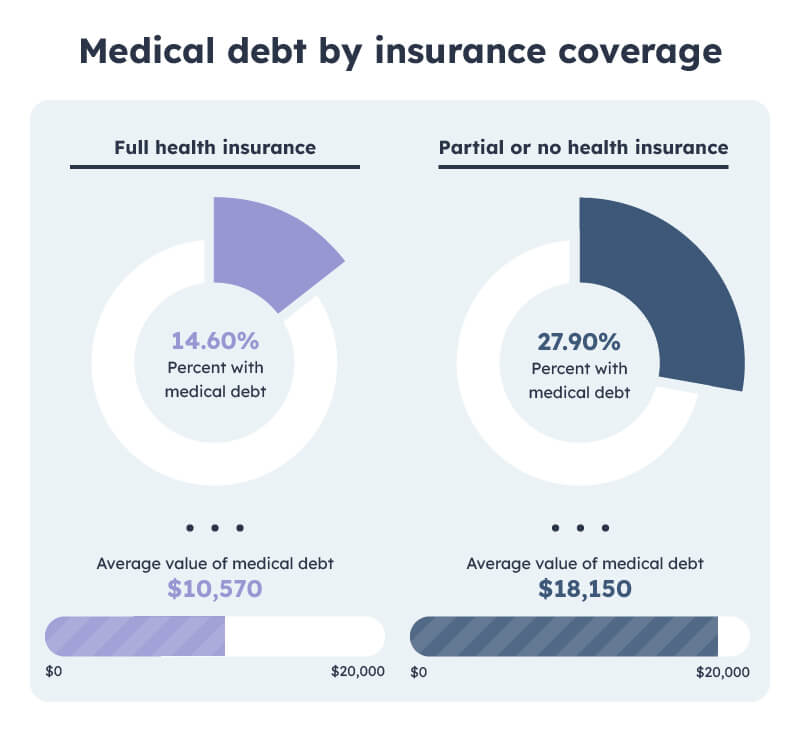
We can also compare the difference in medical debt between people with full health insurance, and those with no or partial coverage. Here we can see that those without full health insurance are much more likely to have medical debt at 27.90% compared to 14.60%. They also have much higher medical debt, owing $18.150 on average compared to $10,570.
Comparing levels of medical debt between states
Levels of medical debt also vary depending on where you are across the country. Some states have much higher rates of medical debt, while others owe much more on average. Here we will explore how states compare in terms of total medical debt, average medical debt, and prevalence of medical debt.
Total statewide levels of medical debt
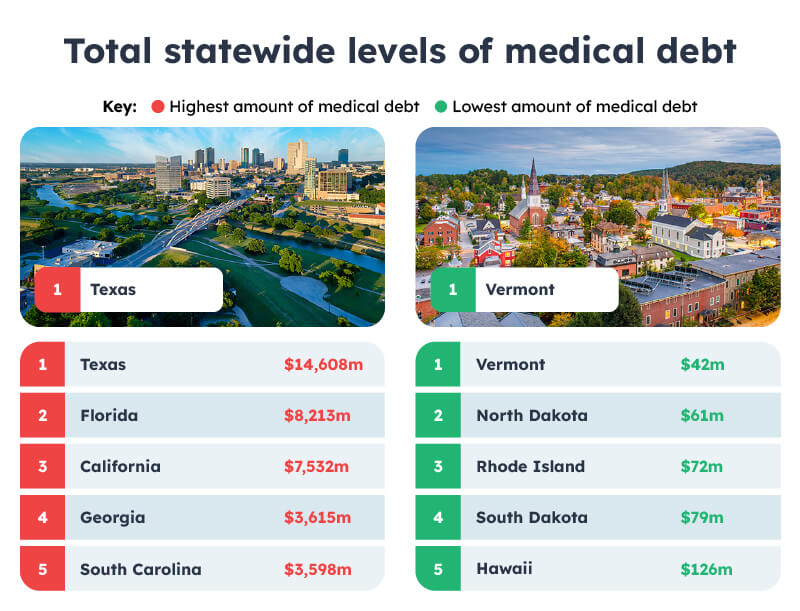
1. Texas
Total Medical Debt: $14,608 million
Texas has the highest amount of medical debt in the country at $14,608 million. This huge sum is far higher than second-place Florida, where the total amount of medical debt stands at $8,213.
| Rank | State | Total medical debt |
|---|---|---|
| 50 | Vermont | $42 M |
| 49 | North Dakota | $61 M |
| 48 | Rhode Island | $72 M |
| 47 | South Dakota | $79 M |
| 46 | Hawaii | $126 M |
| 45 | New Hampshire | $133 M |
| 44 | Minnesota | $148 M |
| 43 | Montana | $279 M |
| 42 | Massachusetts | $296 M |
| 41 | Alaska | $318 M |
50. Vermont
Total Medical Debt: $42 million
Vermont has the lowest level of medical debt of any state at $42 million. This is followed by North Dakota with $61 million and Rhode Island with $72 million. While it may not be the only factor at play, all three of these states have relatively low populations, which will have an impact on the overall amount of medical debt.
The prevalence of medical debt by state
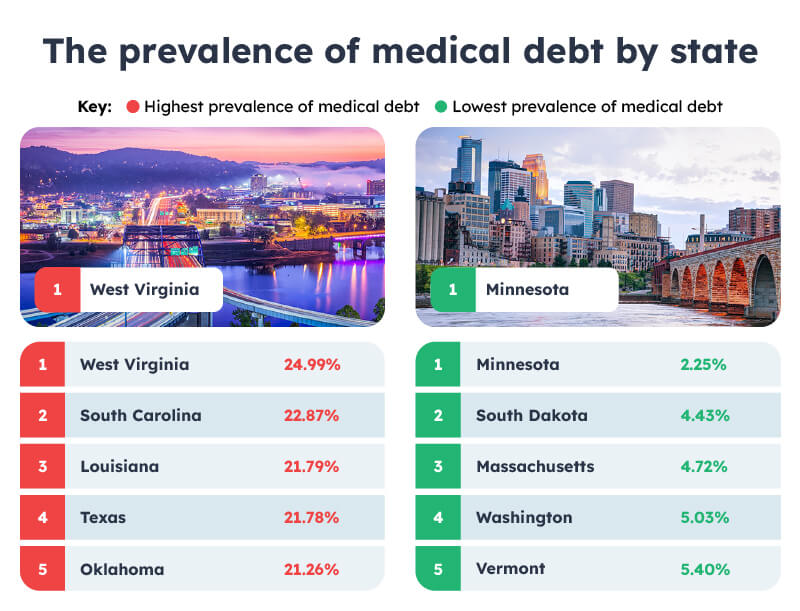
1. West Virginia
Percent of people with medical debt: 24.99%
The state where medical debt is the most common is West Virginia where 24.99%, approximately one-quarter, of people have medical debt. This is just a little more than second-place South Carolina, where 22.87% of people have medical debt, so there’s not a huge amount in it.
50. Minnesota
Percent of people with medical debt: 2.25%
Minnesota has the lowest prevalence of medical debt, with only 2.25% of people owing money for medical expenses. This impressively low rate is followed by South Dakota at 4.43% and Massachusetts at 4.72%.
Average medical debt by state
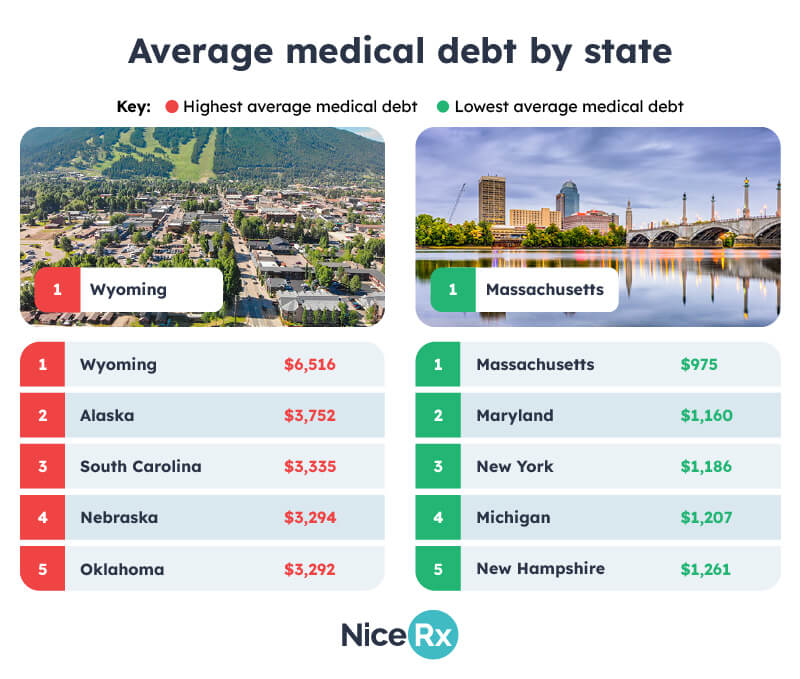
1. Wyoming
Average medical debt: $6,516
Wyoming has the highest average medical debt of any state at $6,516 per person. This is far higher than any other state, with second place Alaska having an average medical debt of $3,752.
50. Massachusetts
Average medical debt: $975
Massachusetts has the lowest average medical debt of any state at just $975, also making it the only state with an average figure below $1,000. Massachusetts is followed by Maryland in second place with an average medical debt of $1,160, while New York state took third place with an average medical debt of $1,186.
Methodology
We wanted to explore the medical debt landscape in the US to see which states and demographics owe the most for medical expenses. To compare different demographics, we used data from the United States Census Bureau, while for state comparisons we used data from the Consumer Protection Bureau.