Salary vs Health Insurance
Which states see most of their wages spent on health insurance? And how does this compare to other costs of living factors?
With the cost of living seemingly rising at an ever-increasing rate, people are paying more attention to their personal finances than ever before. Many of us are cutting back on non-essential spending and making tough choices to ensure we have enough money to cover the cost of daily life.
However, some things are unfortunately too important not to spend money on. These things include necessities such as food, rent, and of course, health insurance. After all, it’s often said that there’s nothing more important than your health, even with the often high price of prescription medication. NiceRx can help lower the cost of weight loss drugs, including compounded semaglutide and compounded tirzepatide.
While many of us benefit from generous workplace schemes that help to cover the cost of our insurance premiums, many others are not so lucky and have to meet high monthly payments to keep their policy intact. Of course, the benefits of being covered mean that in an emergency you can get access to treatment without having to pay full price, and you may have access to more affordable medication to treat ongoing conditions.
As health insurance is so important for safeguarding your wellbeing, as well as being such a large monthly expense for many people, we wanted to find out just how affordable it really is. We’ve pulled together data from a range of sources to see which states pay the most for their health insurance, and what proportion of their salary these policies eat up. We’ll also take a look at some of the large cost of living expenses to see how expensive health insurance is in comparison.
What proportion of your pay goes towards health insurance
Here we can see the average proportion of annual income that people in each state use to cover the cost of health insurance.
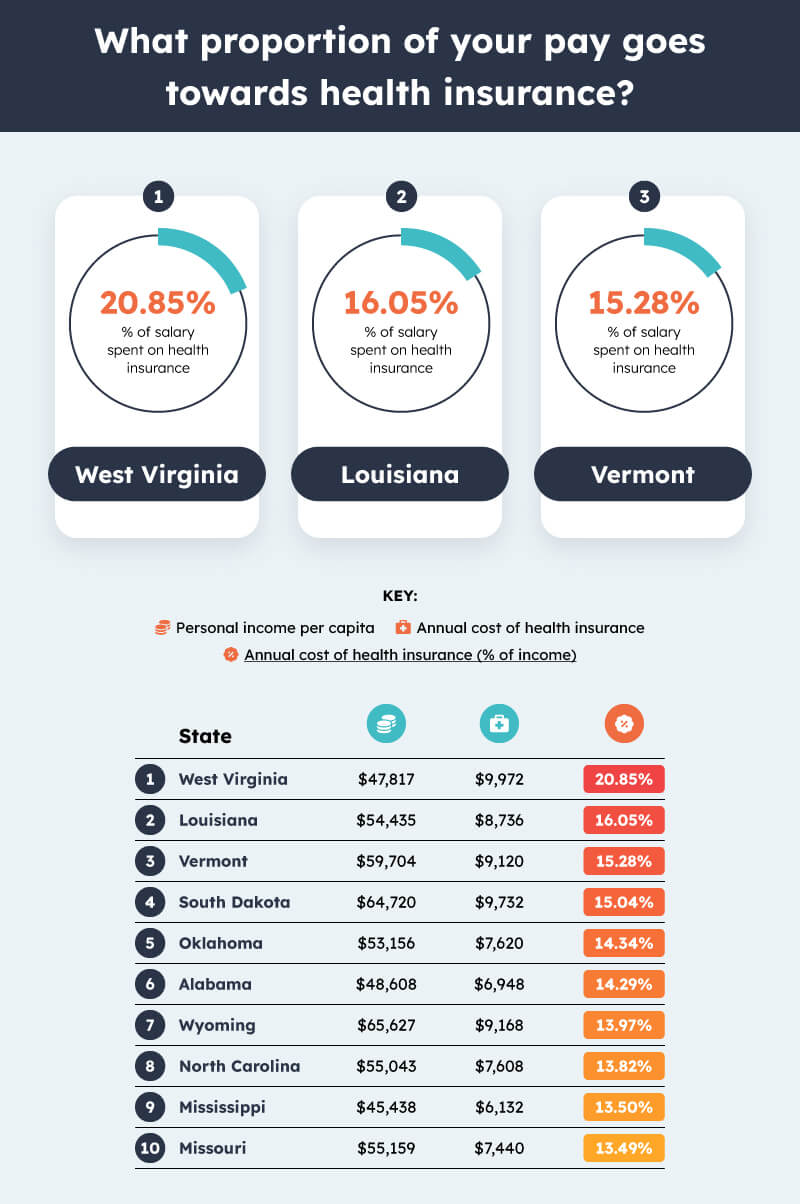
1. West Virginia % of salary spent on health insurance: 20.85%
With an annual personal income per capita of $47,817 and an average cost of health insurance of $9,972, West Virginia sees the highest proportion of wages being spent on health insurance at a huge 20.85%. Even with the cover provided by these high premiums, West Virginians will still have to pay the difference for many , making the total cost of maintaining good health even higher.
2. Louisiana % of salary spent on health insurance: 16.05%
Louisiana took second place, with the average salary being $54,435 while the average cost of health insurance in the state is $8,736. This amounts to 16.05% of the average salary being spent on health insurance.
3. Vermont % of salary spent on health insurance: 15.28%
In third place is Vermont, where the cost of keeping up with your health insurance premiums could eat up 15.28% of your annual salary. With average annual salaries of $59,704 and health insurance costing $9,120, Vermonters are actually paying more for health insurance than those in Louisiana, though their higher wages make it a slightly smaller percentage.
How does the cost of health insurance compare to other major costs of living factors?
Health insurance is far from the only expensive cost of living factor that can put a strain on your personal finances, but how does it stack up against some of the others? We found the average income per capita across all 50 states to be $60,657.90 and used this to compare the average cost of a range of cost of living factors, finding out how much of this average salary they would use up.
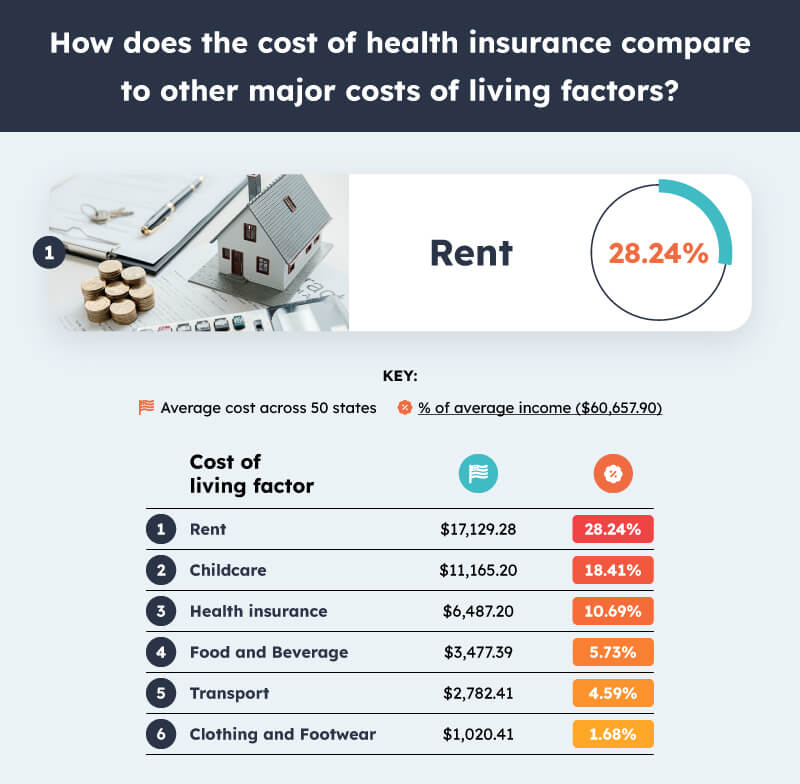
Rent is by far the most expensive cost of living factor, soaking up 28.24% of the average American’s salary, with childcare costing the second-highest amount at 18.41%. Health insurance takes third place with an average cost of $6,487.20 which accounts for 10.69% of the average salary.
The proportion of annual salaries spent on rent across the country
As we just saw, rent is the most expensive cost of living factor, but where in the country spends the largest proportion of their salary just to keep a roof over their head?
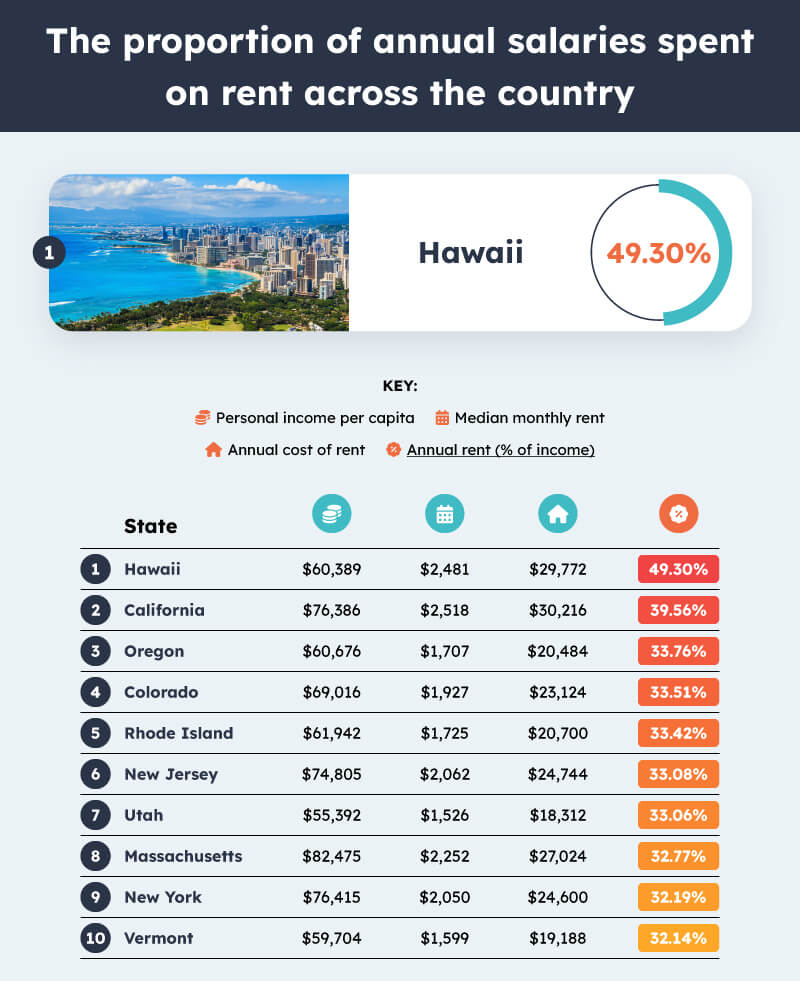
- Hawaii % of salary spent on rent: 49.30%
Hawaii has the most unaffordable rent in the country with the annual cost reaching $29,772 compared to annual salaries of $60,389. This means Hawaiians are spending 49.30% of their salaries, virtually half of their earnings, just to cover the cost of rent.
The cost of childcare as a proportion of the average salary
For many people, the high cost of childcare will come as a surprise, but to the parents who have to cover this cost in order to get to work, it is an all too familiar reality.
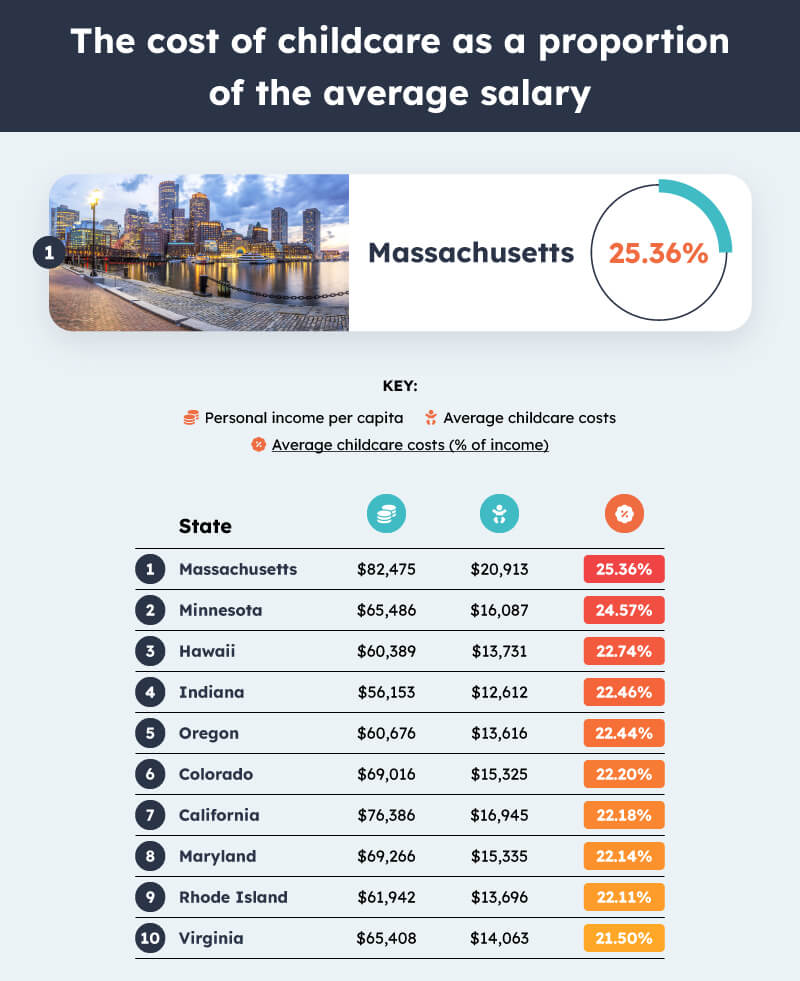
- Massachusetts % of salary spent on childcare: 25.36%
Parents in Massachusetts spend the largest proportion of their salary on childcare out of all 50 states. Despite having the highest average salary in the country at $82,475, the state still sees residents spending an average of 25.36% of their salaries on childcare, which costs over $20,000 a year!
How much is spent on food and beverage in each state?
Spending money on food and beverages is another necessary expense that contributes to the overall cost of living. It’s possibly the most non-negotiable expense as at the end of the day, we all must eat. Here’s how the cost of keeping yourself fed varies from state to state.
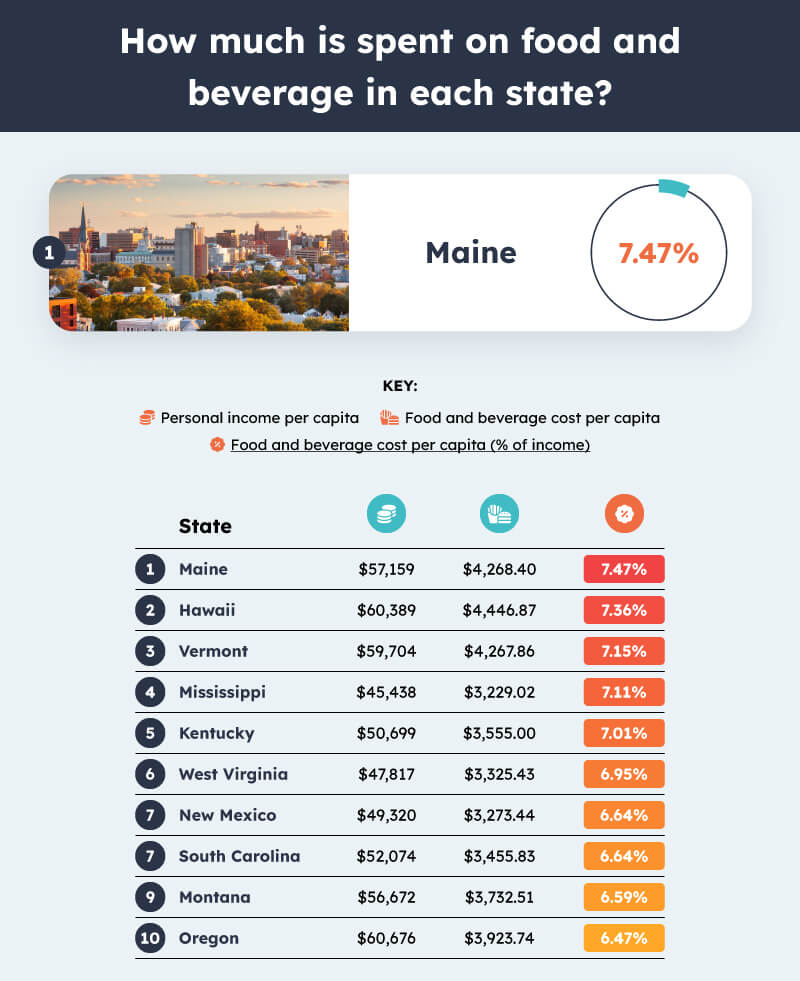
- Maine % of salary spent on food and beverage: 7.47%
People in Maine spend the highest proportion of their salaries on buying food and beverages. An average spend of $4,268.40 compared to an average personal income of $57,159 sees Mainers spending approximately 7.47% of their money on food and drinks.
Transportation costs by state compared to personal income
We all need to leave the house at some point or another, whether for work, to drop the kids off at school, or to do the weekly grocery shop. This makes transportation an important factor to consider when looking at the cost of living.
However, the cost of transport can vary wildly depending on whether you own your own vehicle or rely on transportation services like the bus or train to get around. To counter this, we have combined the amount spent on motor vehicles and parts in each state, with that spent on transportation services, allowing us to see which state pays the most to get around.
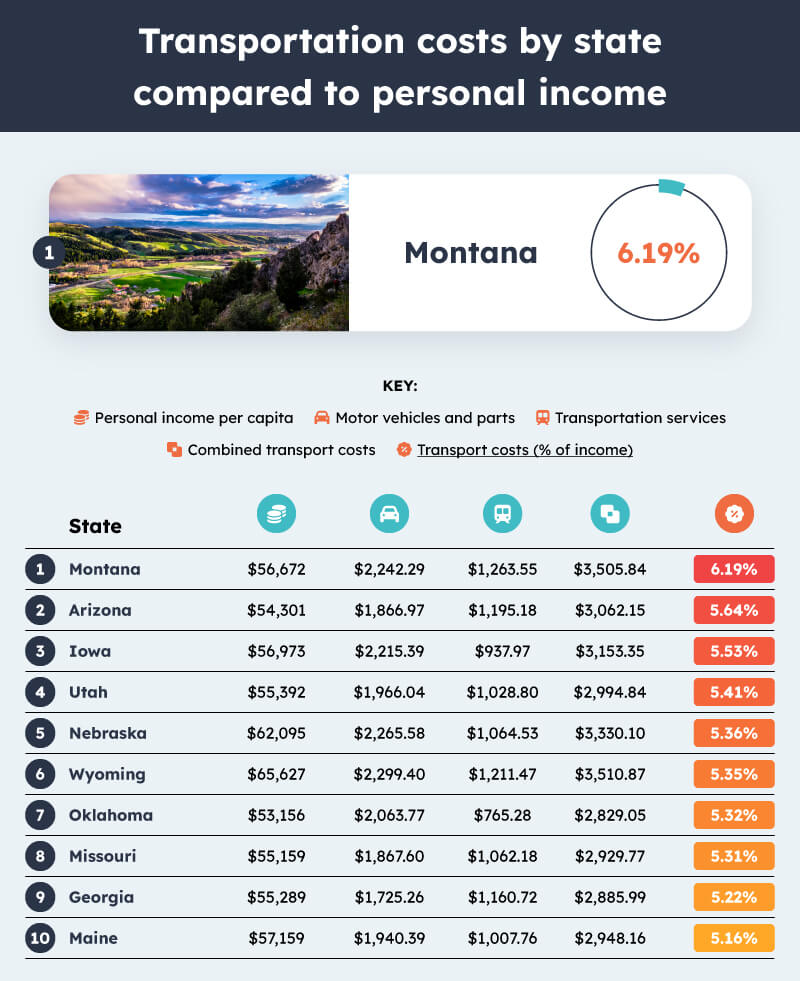
- Montana % of salary spent on transportation: 6.19%
Montana has the highest transportation costs in the country compared to the average income in the state, which stands at $56,672 per capita. Spending an average of $2,242.29 on motor vehicles and parts, with another $1,263.55 spent on transportation services, the total spent on transportation in the state is approximately $3,505.84 per person per year. This means Montanans spend 6.19% of their annual income just on transportation.
The states that spend the greatest portion of their salaries on clothing and footwear
Clothing and footwear are often forgotten about when considering the cost of living. Spending money on clothing is a necessity, with new clothes often required in different seasons, for new jobs, and especially for young children who quickly outgrow or wear out their clothes.
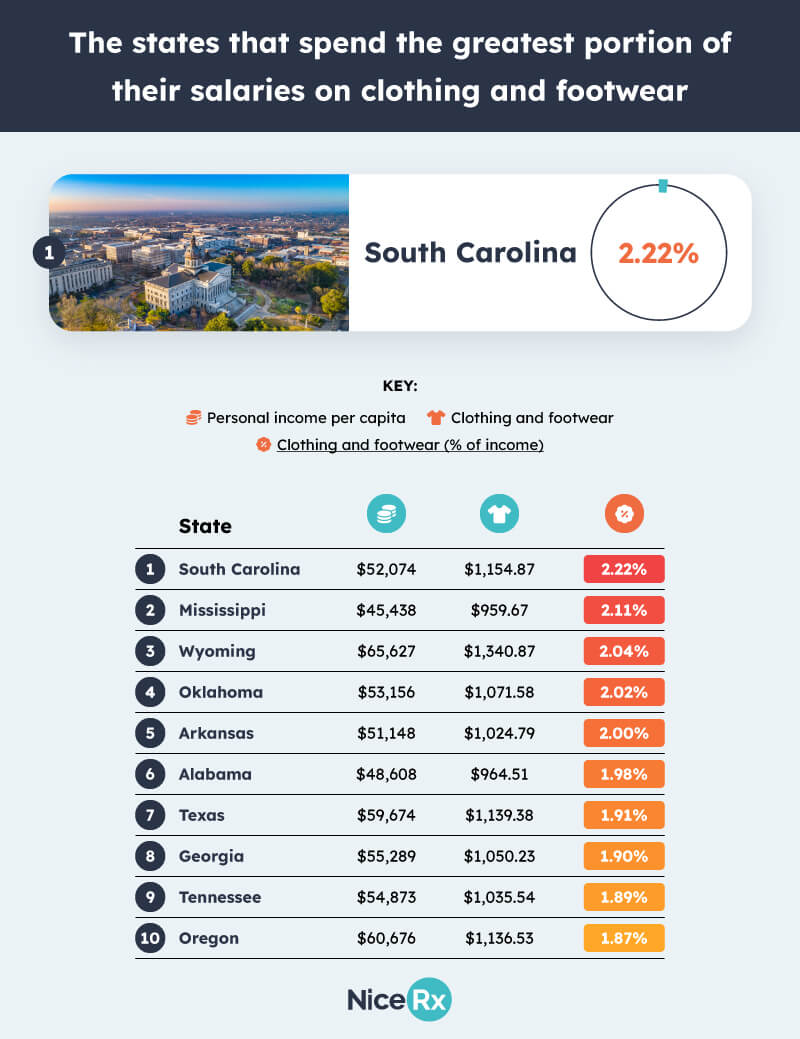
- South Carolina % of salary spent on clothing and footwear: 2.22%
People in South Carolina spend the largest proportion of their income on clothing and footwear at 2.22%, based on an average income of $52,074 and a spend of $1,154.87. While much lower than many other costs of living factors, this is still a considerable expense that contributes significantly to the overall strain on people’s finances.
Methodology
We wanted to assess the cost and affordability of health insurance and other costs of living factors from state to state. To do this, we collected health insurance data from Value Penguin, data on personal income and the cost of food and beverages, transportation, and clothing and footwear from the Bureau of Economic Analysis. We also collected data for the cost of renting from a study by Patriot Software, and found data for the cost of childcare from World Population Review.
Once we had all of our data, we compared the annual cost of each factor to their personal income in each state. This allowed us to calculate what percentage of annual income is spent on each factor in the state, revealing just how affordable these factors are.